
🎓 Check Out My Top 25 Udemy Courses (80-90% Discount): My Udemy Courses - Ramesh Fadatare
In this JavaFX example, we will see how to create a Line Chart using JavaFX.
A line chart is a basic type of chart that displays information as a series of data points connected by straight line segments.A line chart in JavaFX is created with the javafx.scene.chart.LineChart.
JavaFX Line Chart Example
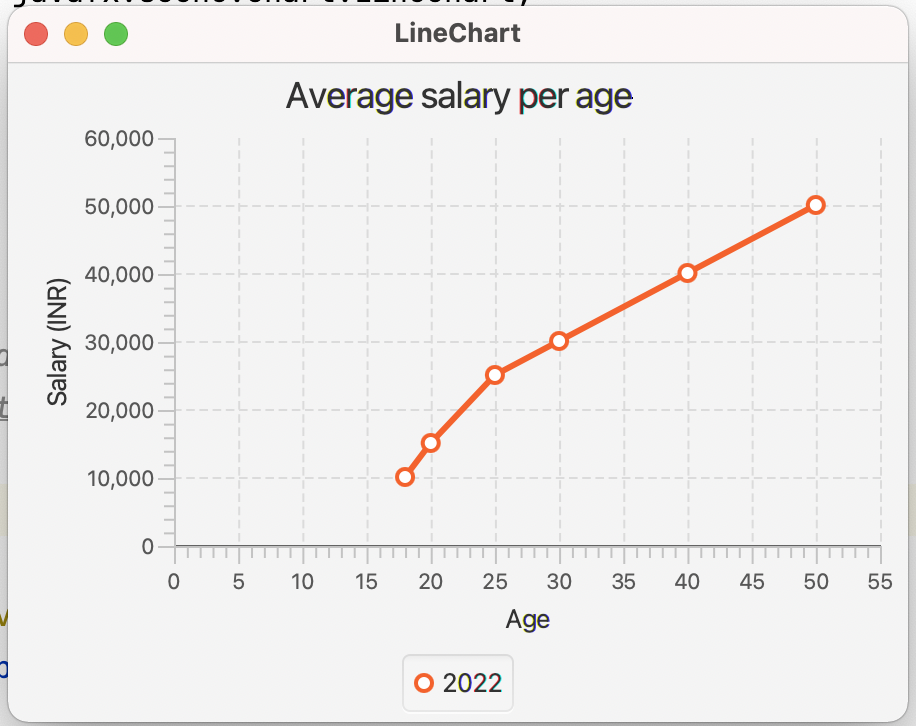
In the example, we have a line chart showing the average salary per age.package sample;
import javafx.application.Application;
import javafx.scene.Scene;
import javafx.scene.chart.LineChart;
import javafx.scene.chart.NumberAxis;
import javafx.scene.chart.XYChart;
import javafx.scene.layout.HBox;
import javafx.stage.Stage;
/**
* JavaFX LineChart Example
* @author https://www.sourcecodeexamples.net/
*/
public class Main extends Application {
@Override
public void start(Stage stage) {
initUI(stage);
}
private void initUI(Stage stage) {
HBox root = new HBox();
Scene scene = new Scene(root, 450, 330);
NumberAxis xAxis = new NumberAxis();
xAxis.setLabel("Age");
NumberAxis yAxis = new NumberAxis();
yAxis.setLabel("Salary (INR)");
LineChart lineChart = new LineChart<>(xAxis, yAxis);
lineChart.setTitle("Average salary per age");
XYChart.Series data = new XYChart.Series<Number, Number>();
data.setName("2022");
data.getData().add(new XYChart.Data<>(18, 10000));
data.getData().add(new XYChart.Data<>(20, 15000));
data.getData().add(new XYChart.Data<>(25, 25000));
data.getData().add(new XYChart.Data<>(30, 30000));
data.getData().add(new XYChart.Data<>(40, 40000));
data.getData().add(new XYChart.Data<>(50, 50000));
lineChart.getData().add(data);
root.getChildren().add(lineChart);
stage.setTitle("LineChart");
stage.setScene(scene);
stage.show();
}
public static void main(String[] args) {
launch(args);
}
}Output:
Related JavaFX Examples
- JavaFX GridPane Example
- JavaFX ColorPicker Example
- JavaFX DatePicker Example
- JavaFX MenuBar Example
- JavaFX Radio Button Example
- JavaFX TabPane Example
- JavaFX Accordion Example
- JavaFX Login Form Validation Example
- JavaFX Form Validation - Registration Form Validation Example
- JavaFX Line Chart Example
- JavaFX Area Chart Example
- JavaFX Scatter Chart Example
- JavaFX Bar Chart Example
- JavaFX Pie Chart Example
- JavaFX Select and Multi-Select Example
- JavaFX Check Box Example
- Java Calculator Project
My Top and Bestseller Udemy Courses. The sale is going on with a 70 - 80% discount. The discount coupon has been added to each course below:

Build REST APIs with Spring Boot 4, Spring Security 7, and JWT
🆕 High-Demand
80–90% OFF
![[NEW] Learn Apache Maven with IntelliJ IDEA and Java 25](https://img-c.udemycdn.com/course/750x422/6852721_b512_2.jpg "[NEW] Learn Apache Maven with IntelliJ IDEA and Java 25")
[NEW] Learn Apache Maven with IntelliJ IDEA and Java 25
🆕 High-Demand
80–90% OFF

ChatGPT + Generative AI + Prompt Engineering for Beginners
🚀 Trending Now
80–90% OFF
")
Spring 7 and Spring Boot 4 for Beginners (Includes 8 Projects)
🔥 Bestseller
80–90% OFF
Available in Udemy for Business
Available in Udemy for Business

Building Real-Time REST APIs with Spring Boot - Blog App
🔥 Bestseller
80–90% OFF
Available in Udemy for Business
Available in Udemy for Business

Building Microservices with Spring Boot and Spring Cloud
🌟 Top Rated
80–90% OFF
Available in Udemy for Business
Available in Udemy for Business

Java Full-Stack Developer Course with Spring Boot and React JS
🔥 Bestseller
80–90% OFF
Available in Udemy for Business
Available in Udemy for Business

Build 5 Spring Boot Projects with Java: Line-by-Line Coding
🌟 Top Rated
80–90% OFF

Testing Spring Boot Application with JUnit and Mockito
🔥 Bestseller
80–90% OFF
Available in Udemy for Business
Available in Udemy for Business

Spring Boot Thymeleaf Real-Time Web Application - Blog App
🔥 Bestseller
80–90% OFF
Available in Udemy for Business
Available in Udemy for Business

Master Spring Data JPA with Hibernate
🔥 Bestseller
80–90% OFF
Available in Udemy for Business
Available in Udemy for Business

Spring Boot + Apache Kafka Course - The Practical Guide
🎓 Student Favorite
80–90% OFF
Available in Udemy for Business
Available in Udemy for Business


")

Comments
Post a Comment
Leave Comment